

Hello From Pagosa Country!
The biggest story around town continues to be the weather – warm and dry! The snowpack in our mountains is at 63% of median for this time of year. Wolf Creek Ski Area is reporting 58” of snow at the summit with total snowfall year-to-date at 143”. Yesterday got up to 64 degrees in town, which is about 20 degrees above average. It looks like we have a decent chance of getting some rain and snow later in the week, which will certainly be welcome. If we don’t get a lot of moisture this spring, we’ll likely be smelling smoke this summer.
Even with the lack of snow this year, town continues to stay very busy, and it’s going to get even busier over the next several weeks as the Spring Break crowds come in from Texas and Oklahoma. This is the last big surge before the offseason. All the local merchants depend on this bump in traffic to get them through the slower months until we start up again in the summer. After Spring Break, it’s usually mud season, but this year we don’t have any snow on the ground to melt and make mud!
The other story that’s increasingly being discussed around town is the big highway construction project which will soon start on main street downtown. Traffic will be cut down to one lane in each direction as they replace the asphalt between 1st Street and 8th Street with concrete. They are also going to install some new crosswalks, sidewalks, and ramps. While they’ve got the highway torn apart, various local utilities will have the opportunity to make upgrades and repairs underneath the roadway. The project will begin March 24th and is scheduled to last into the fall of 2026.
Now for the latest real estate news. In general, the first couple of months of 2025 have been fairly positive. The overall number of sales is up 7% over last year. Vacant land and condo sales are up while home sales are down. Inventory is up across the board. Inventory is up by 233% in the price range of $400,000 to $500,000, while sales are down 56% in the same category. The buyers in this category are generally reliant on financing, and mortgage rates are still pretty high. This may be the reason why this sector of the market is dragging.
A 30-year fixed-rate mortgage is currently averaging 6.74%, and a 15-year is at 6.25%. This is lower than it was a month ago as rates have come down about a half percent. I’m not overly optimistic that we’re going to see much of a change in the near future, but I hope I’m wrong!
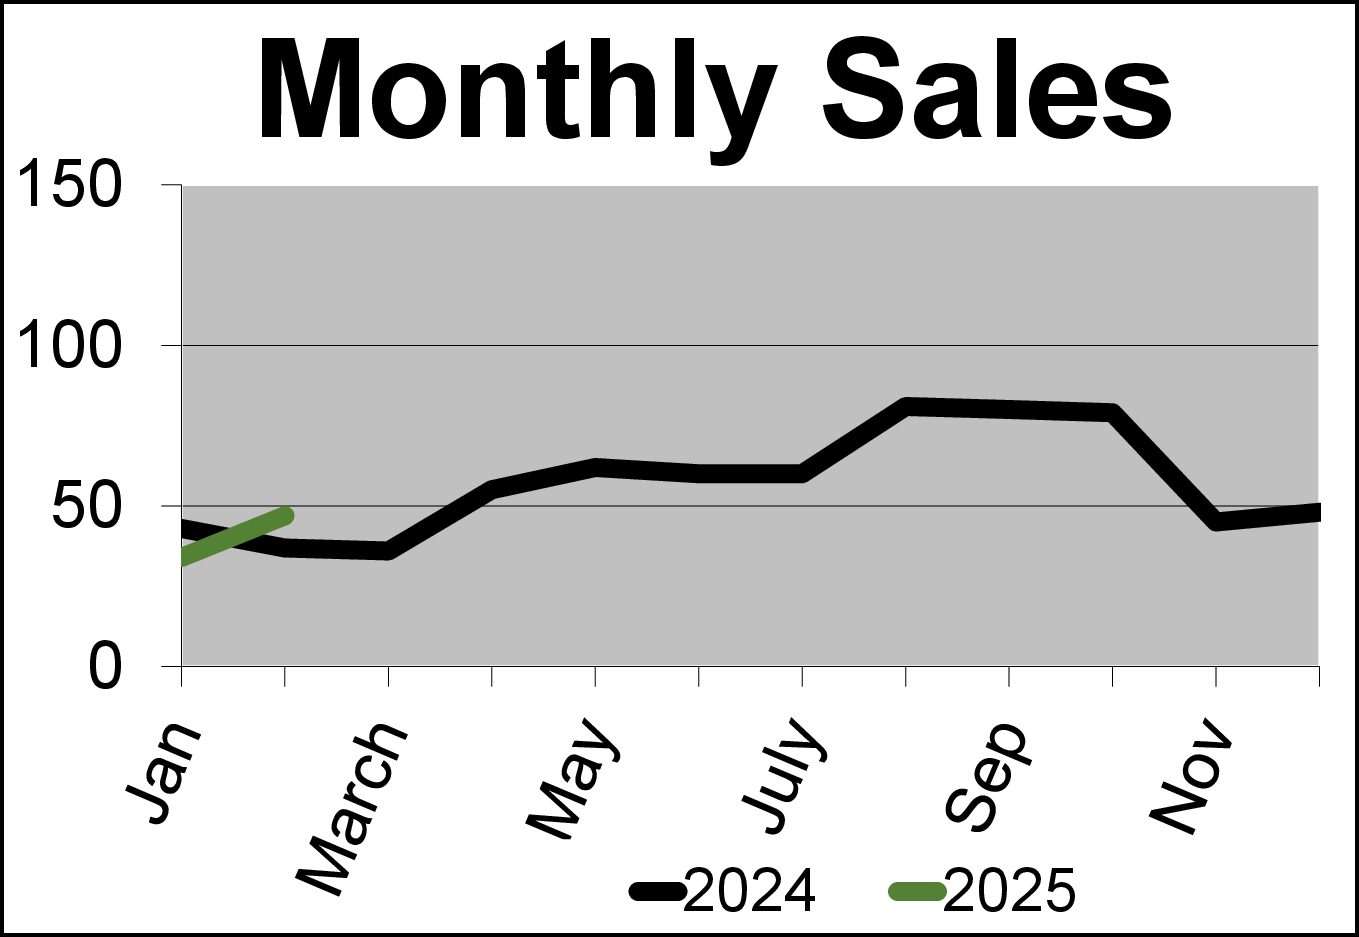
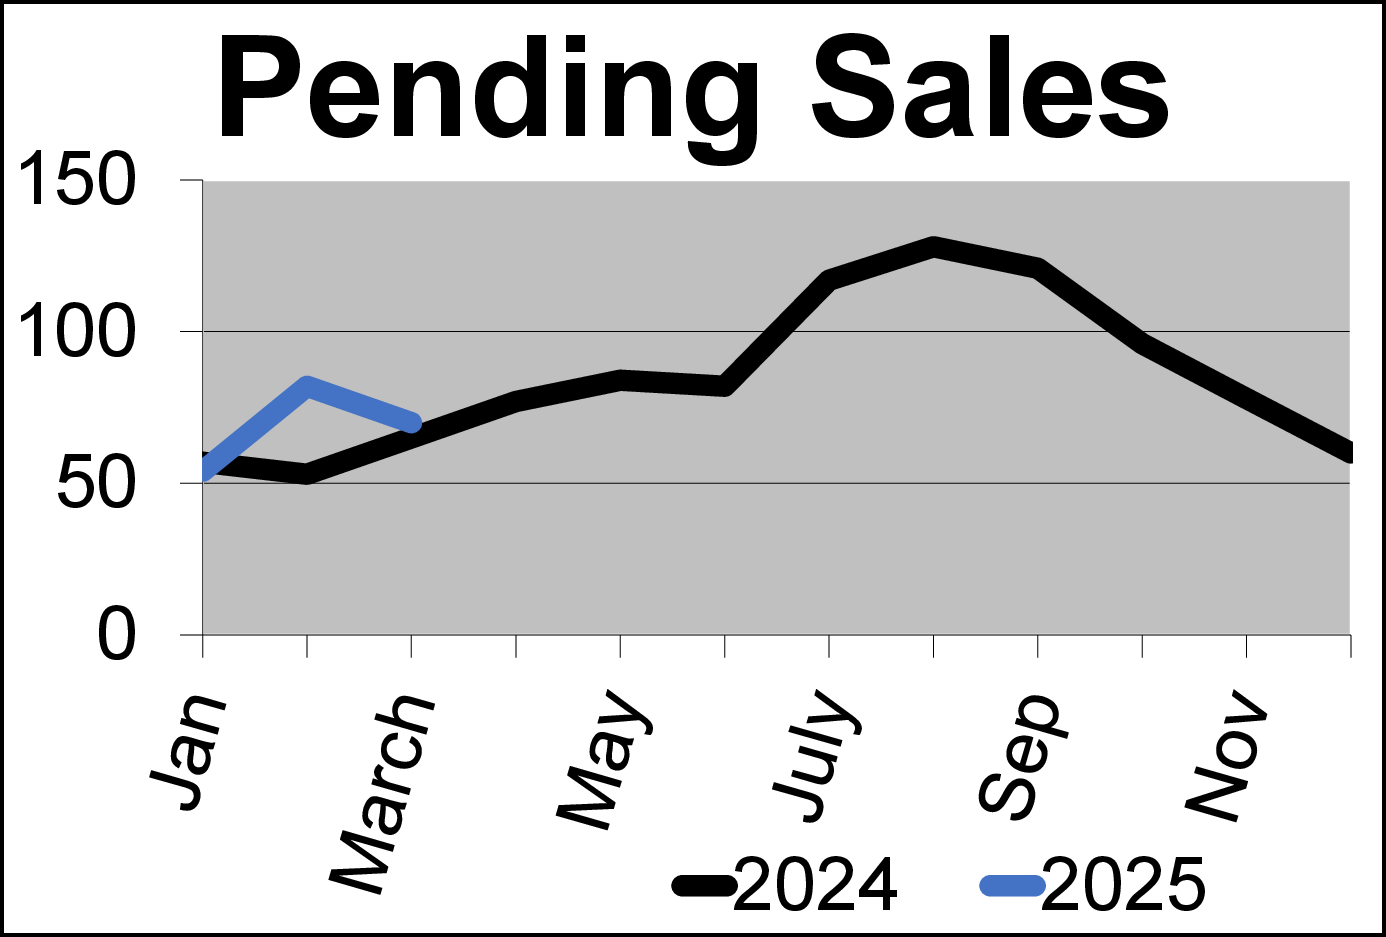
We’ve had 8 condo sales compared to 6 last year at this time, and available inventory is up to 35 compared to 21 last year. This is a shocking increase from 2022, when there were only 3 condos available on the market! Land sales were up 22% compared to last year, and inventory is nearly flat. Both January and February saw increases in sales over 2024, and the pending sales are up as well. This sets a positive tone for the rest of the year. Make sure you check out the stats & graphs for the full picture.
The last thing I want to talk to you about is building costs. I talked to the folks at Ponderosa Lumber, who provide most of the building materials to home builders in our area. Lumber prices are flat, or even down slightly, which is great news for building costs. I talked to a couple of home builders as well, and they reported pretty much the same thing. It’s hard to predict whether any tariffs will go into effect in Canada. If they do, it might effect local lumber prices. We’ll have to wait and see.
Since we’ve had such a mild winter, the local builders are off to an early start on their 2025 projects. The weather has not been as big an issue for them as it has been in recent years. This is good news if you’re a builder and you’ve got to get your projects dried in before the snow starts to fly.
So long for now! Remember to stop and smell the daffodils, which should be coming up any day now!
Lee Riley
970-946-3856 (cell)
[email protected]
P.S. Remember, with my CRS referral network, I can provide you with a top notch Realtor anywhere in the country. CRS stands for Certified Residential Specialist, a professional designation that only 4% of the Realtors in the country have earned. If you or someone you know is relocating, I can refer you to a certified CRS agent.

GRI, CRS
2011 & 2014 Realtor of the Year
Phone (970) 731-4065
Fax (970) 731-4068
Cell (970) 946-3856
Email: [email protected]